Project Description
3D Thematic Mapping is a program for visualizing geospatial data on a globe. Cylindrical bars normal to the center of each country are scaled and colored based on the value of some variable such as population.
Controls:
- h - move left/west
- j - move down/south
- k - move up/north
- l - move right/east
- i - zoom in
- o - zoom out
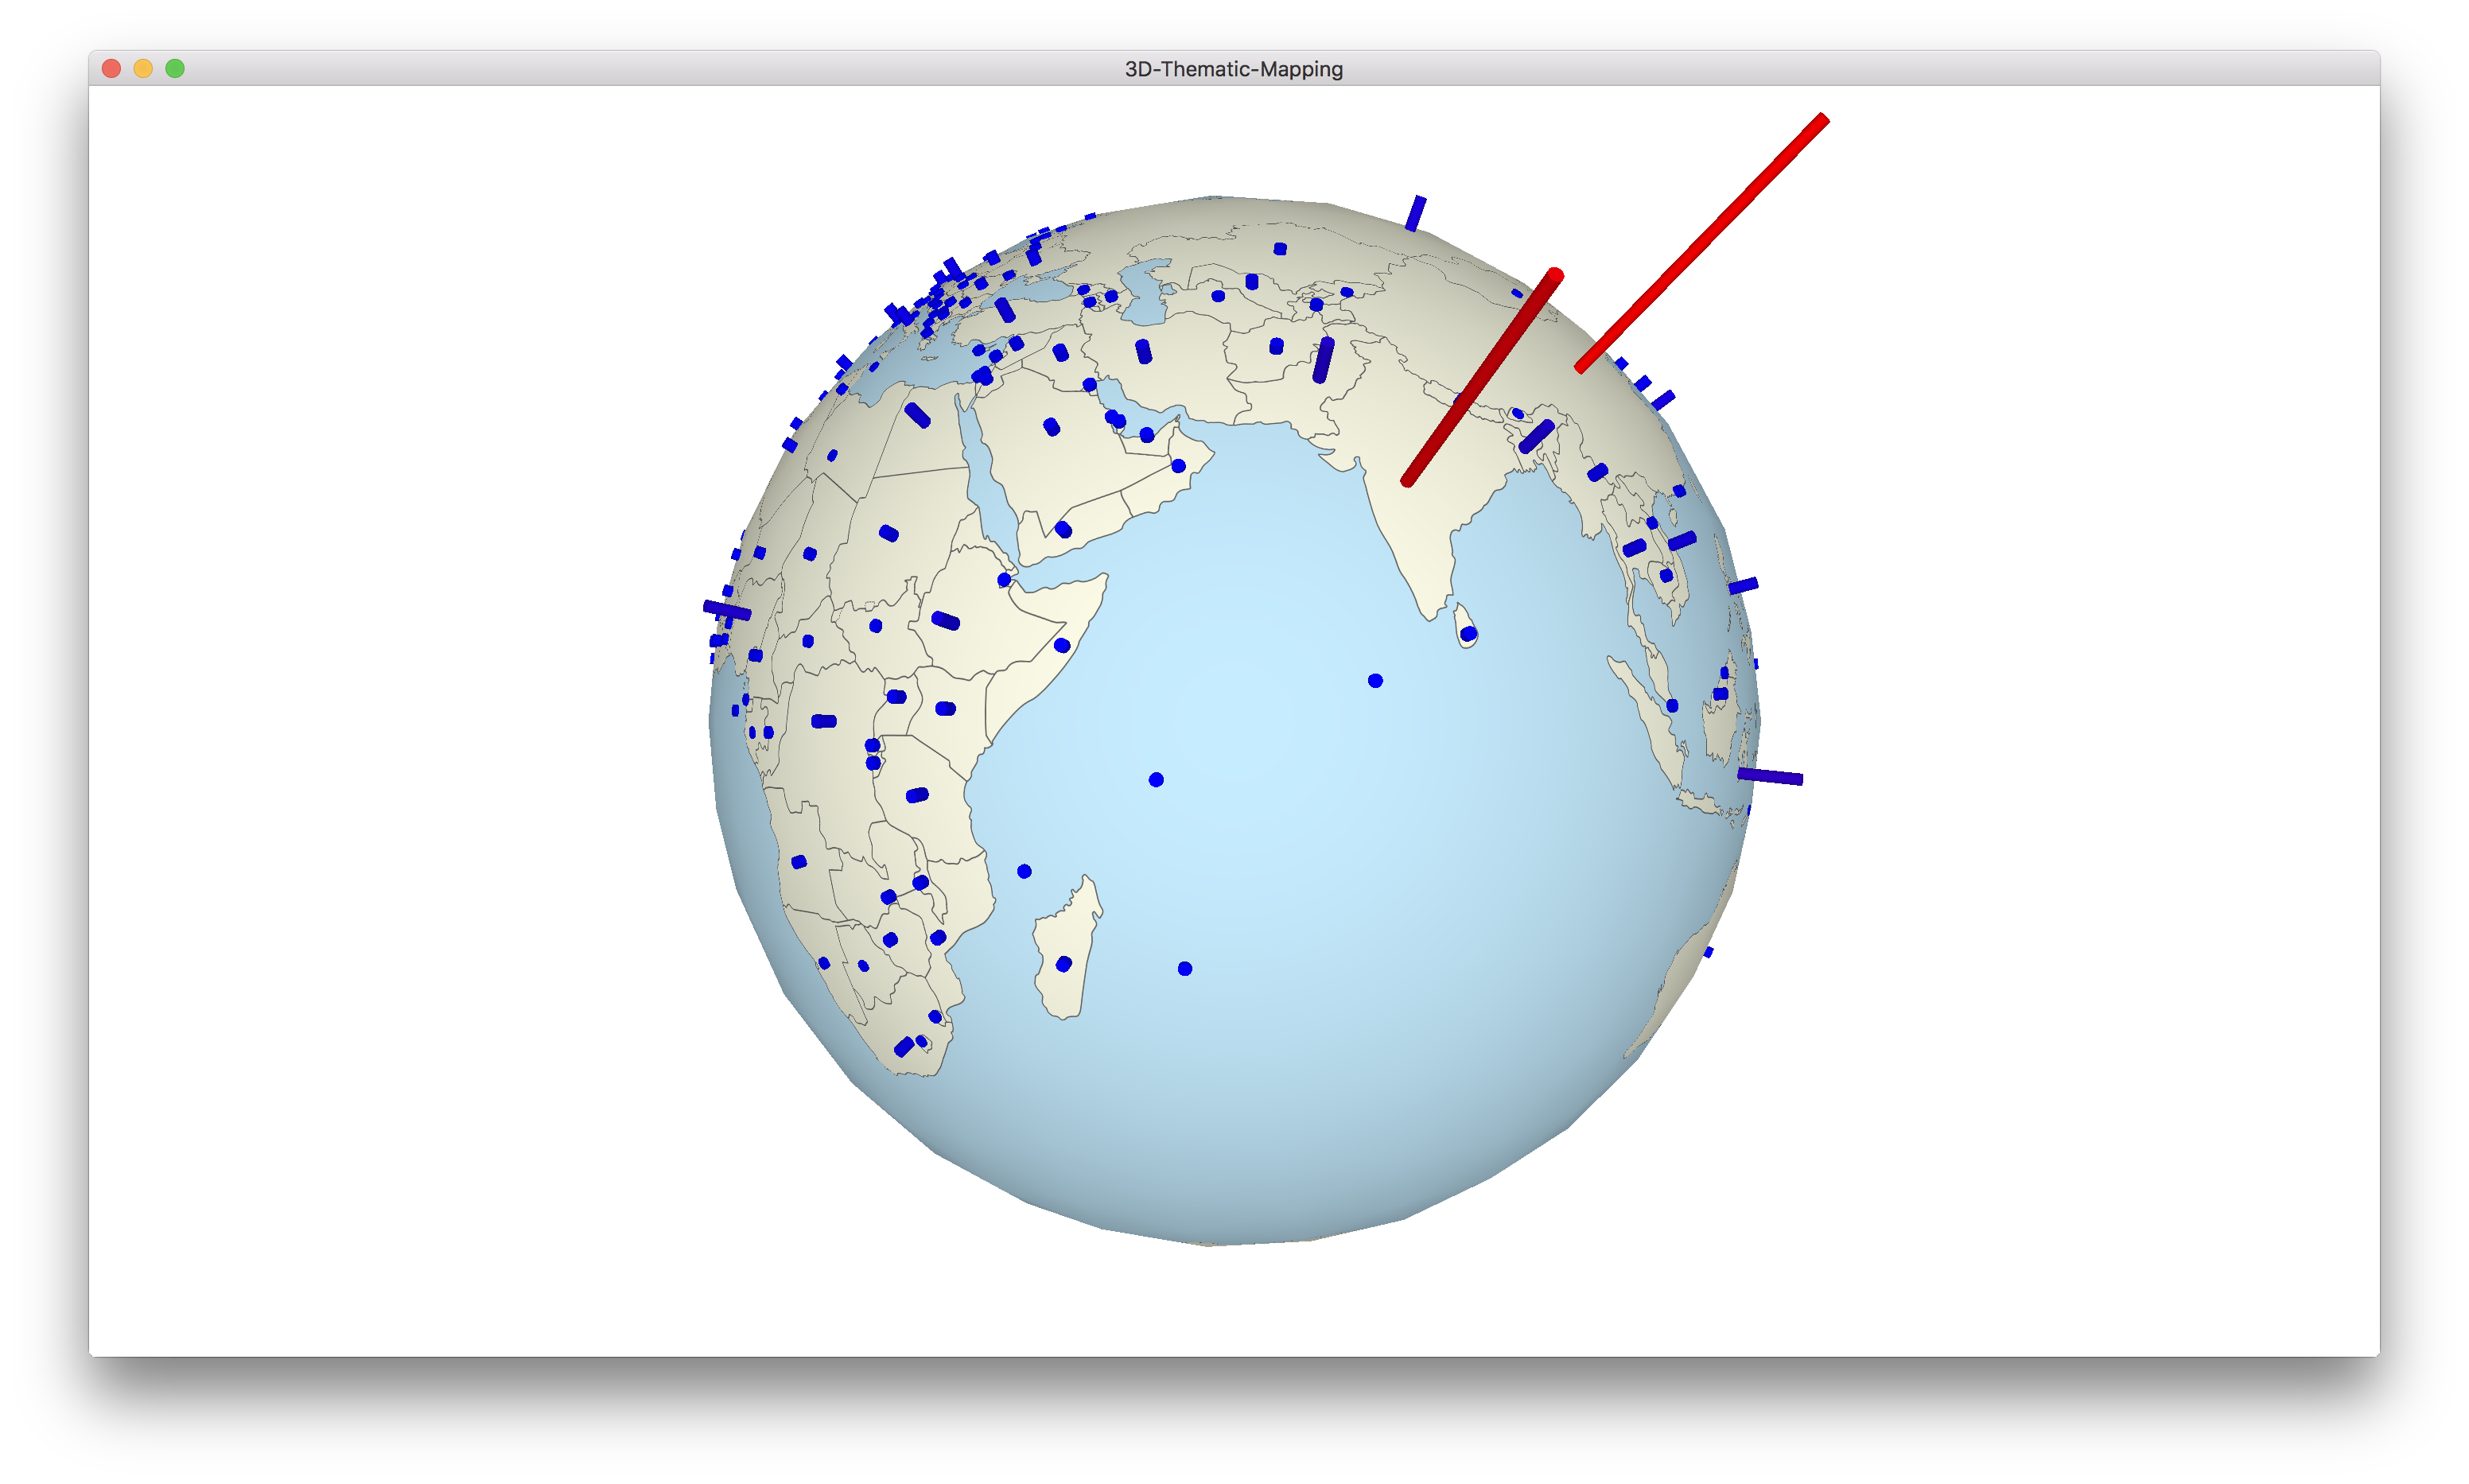 Population 2016
Details
Data is from the World Development Indicators provided by the World Bank. As is the program displays population data from 2016.